22 Jul 2026
Behavioral Analytics Shape Visual Layout Adjustments in Mobile Athletic Wagering and Slot Interfaces
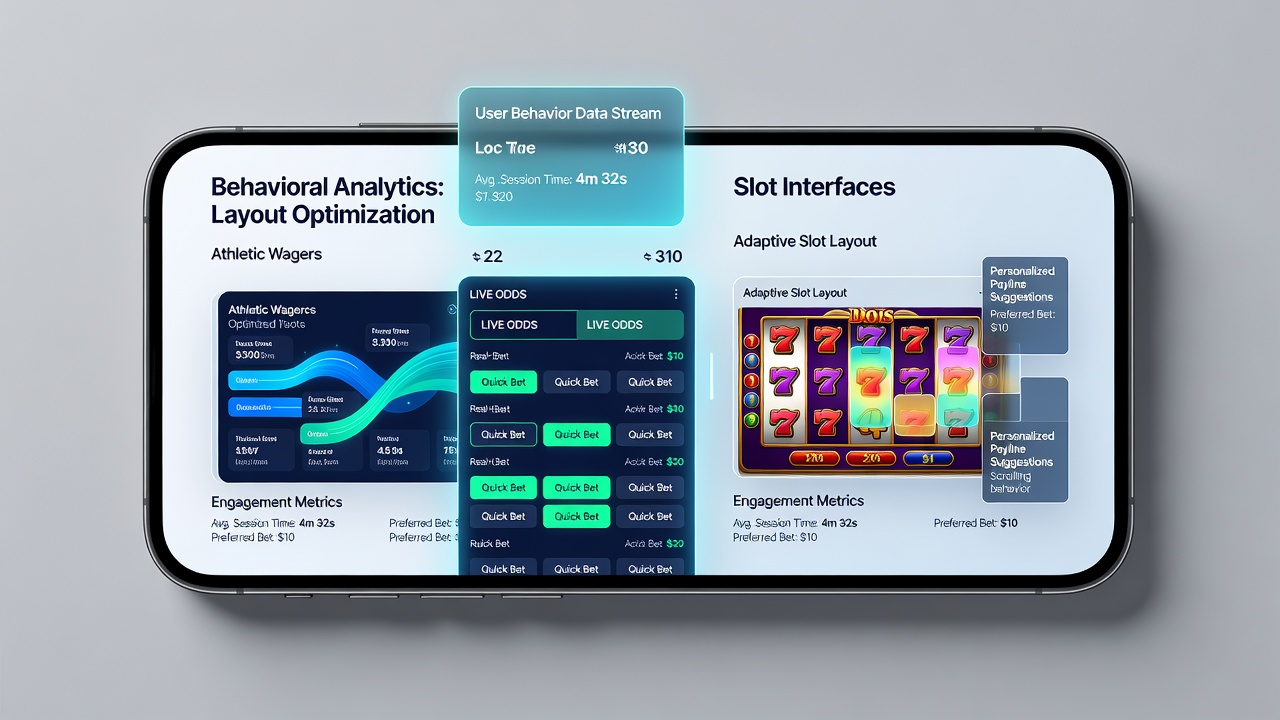
Behavioral analytics collect user interaction data such as tap patterns, scroll depth, session duration, and navigation paths within mobile applications, and these metrics guide iterative adjustments to button placement, color schemes, menu hierarchies, and content density on athletic wagering screens as well as reel-based slot displays. Developers track these signals through integrated software development kits that log anonymized events in real time, allowing teams to identify friction points where users abandon sessions or hesitate before placing wagers.
Data Collection Mechanisms Behind Layout Decisions
Platforms aggregate heatmaps, funnel analyses, and cohort segmentation to determine which interface elements receive the most attention during peak hours, and this information informs A/B testing frameworks that compare variant layouts across large user groups. Researchers at institutions such as the University of Nevada, Las Vegas have documented how eye-tracking studies combined with clickstream logs reveal optimal positioning for odds displays and bet-slip confirmations in sports interfaces, while similar methods applied to slot games highlight preferred reel sizes and bonus trigger animations. As of July 2026 these testing cycles typically run for two to four weeks before permanent rollout, because cumulative data sets reach statistical significance thresholds that reduce the risk of negative engagement shifts.
Application in Athletic Wagering Interfaces
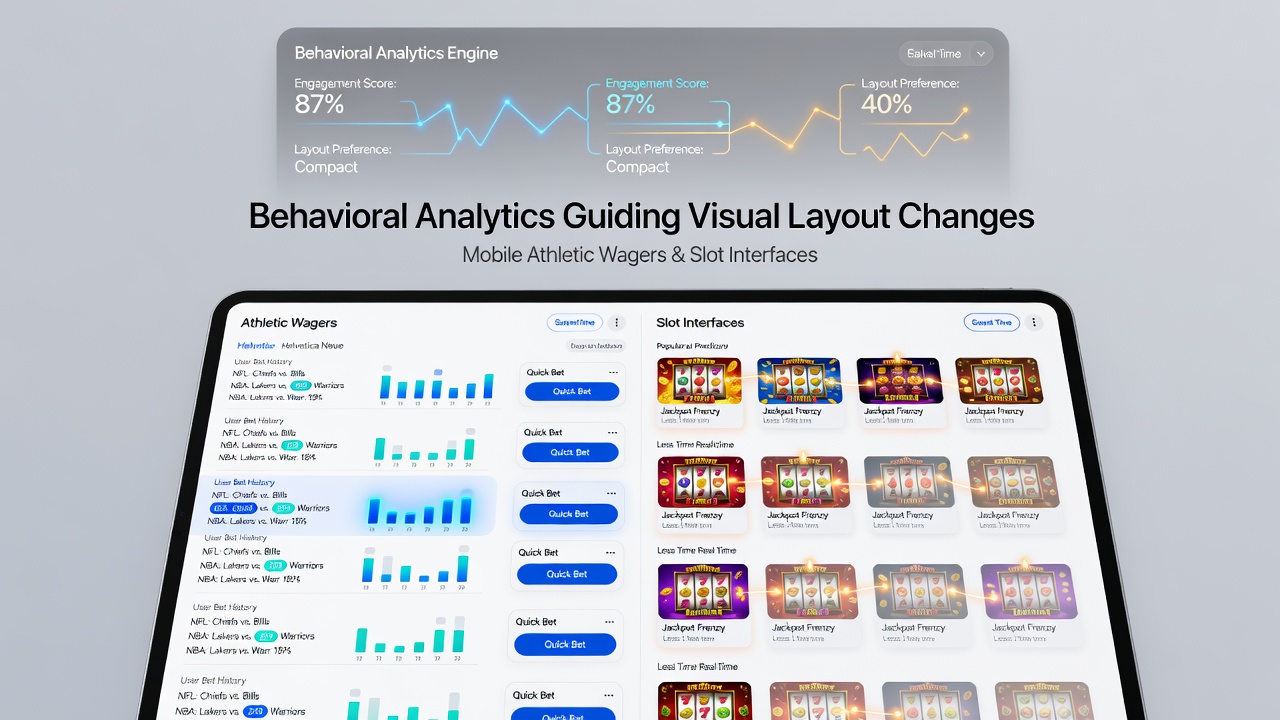
In mobile sports betting applications, analysts examine how users navigate between live event odds, pre-match markets, and cash-out features, and they adjust thumbnail sizes for team logos or reposition the quick-bet sliders based on observed thumb reach zones on various device screen sizes. When data shows higher completion rates for wagers placed through floating action buttons rather than bottom navigation bars, teams migrate those controls upward while preserving regulatory-mandated responsible gaming prompts in fixed locations. Cohort comparisons between new and returning users further refine font scaling and contrast ratios, ensuring that time-sensitive information like in-play score updates remains legible under varying lighting conditions reported by device sensors.
Adjustments Observed in Slot Game Presentations
Slot interfaces undergo parallel refinements when session replay data indicates prolonged dwell times on paytable screens or frequent zooming gestures around symbol clusters, prompting developers to enlarge winning line indicators or streamline the transition between base game and feature rounds. Color temperature adjustments and animation speed tweaks emerge from multivariate tests that measure spin frequency and feature activation rates across demographic segments, and these changes often coincide with seasonal content updates tied to sporting events or holiday themes. Integration with device-level accessibility settings has also increased, since analytics flag higher exit rates among users who enable larger text modes or reduced motion preferences.
Integration with Broader Platform Ecosystems
Cross-product analytics connect sports betting sessions with adjacent slot activity, revealing migration patterns that influence shared navigation elements such as account balance widgets and deposit shortcuts. When users who complete a wager frequently proceed to low-volatility slot titles, designers test unified header designs that maintain consistent branding without increasing cognitive load during rapid context switches. Partnerships between analytics vendors and game studios have produced standardized event taxonomies that facilitate benchmarking across operators, and these frameworks support compliance reporting required by bodies including the Nevada Gaming Control Board and the Malta Gaming Authority.
Technical Implementation and Measurement Protocols
Implementation relies on server-side configuration flags that enable rapid rollback of layout variants if key performance indicators such as average revenue per user or time-to-first-bet deviate from control group baselines. Privacy-preserving techniques including differential privacy and on-device aggregation have gained adoption following regulatory guidance issued in multiple jurisdictions during 2025, ensuring that individual behavioral profiles remain protected while aggregate insights continue to drive design iterations. Machine learning models trained on historical layout performance data now predict the likely impact of proposed changes before any user exposure occurs, shortening development timelines from months to weeks.
Conclusion
Behavioral analytics continue to supply the empirical foundation for visual layout evolution in mobile athletic wagering and slot environments, with ongoing measurement confirming that data-guided adjustments sustain engagement metrics across diverse device ecosystems and user cohorts. The practice integrates technical instrumentation, regulatory compliance, and iterative testing into a continuous feedback loop that adapts interfaces to observed interaction patterns without relying on subjective design preferences.