21 Jun 2026
Data Analytics Shaping Retention Approaches in Mobile Sports Betting and Virtual Dealer Settings

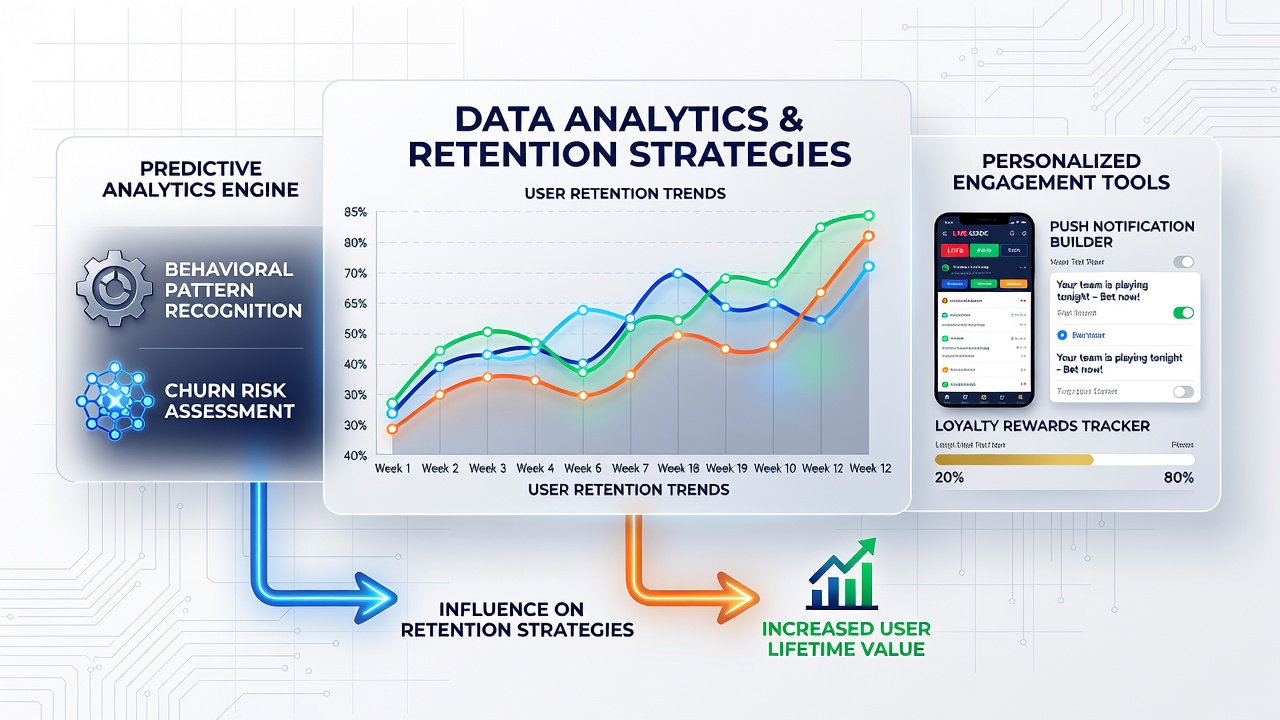
Data analytics tools track player behavior patterns across mobile sports wagering platforms and virtual dealer environments, allowing operators to adjust retention strategies based on real-time information about engagement levels, bet types, and session durations. These systems collect data from login times, wager amounts, and game preferences, then apply algorithms that identify users at risk of reducing activity or leaving the platform entirely.
Core Mechanisms in Sports Wagering Retention
Operators use predictive models to forecast churn by analyzing factors such as declining deposit frequency, shifts in preferred sports markets, and changes in average bet size. When these indicators appear, platforms trigger targeted offers including free bets or enhanced odds on specific events. In June 2026 reports from several major operators showed that such interventions increased return rates among flagged users by measurable margins compared to control groups that received standard promotions.
Segmentation plays a central role as well. Analytics divide users into cohorts based on geographic location, device type, and historical performance in live betting versus pre-match wagers. This allows for customized notifications that align with individual patterns, for instance sending push alerts about upcoming matches in leagues a user has bet on previously while avoiding messages about unrelated sports.
Application Within Virtual Dealer Environments
Virtual dealer platforms apply similar data streams to table game sessions, monitoring decisions such as bet sizing on blackjack, roulette wheel selections, and time spent at particular games. Retention tools then adjust elements like bonus eligibility or table limits for individual players. One study released by iGaming Ontario in early 2026 documented how operators used session heat maps to reposition virtual tables and reduce drop-off during peak evening hours.
These environments also integrate cross-platform data. When a user moves from sports wagering into live dealer blackjack, analytics systems recognize the transition and maintain continuity in loyalty tracking. This prevents the loss of momentum that occurs when separate systems fail to share information, a common issue before unified data platforms became standard.
Churn Prediction and Personalized Interventions
Machine learning models process historical datasets to assign churn probability scores. High-risk users receive sequenced communications that begin with subtle engagement prompts before escalating to more direct incentives. According to findings shared by the European Gaming and Betting Association, platforms employing tiered intervention sequences retained approximately 18 percent more users over a six-month period than those relying on uniform outreach.
Timing proves critical in these strategies. Data reveals that interventions delivered within 48 hours of a detected behavior change produce stronger results than delayed responses. Operators therefore maintain automated pipelines that activate offers the moment threshold conditions are met, whether that involves reduced login frequency or sudden withdrawal of funds from a sports account.
Integration With Broader Platform Features
Analytics also inform content scheduling. Sports wagering apps adjust featured markets and virtual dealer lobbies based on collective user activity peaks, ensuring that high-engagement periods coincide with popular events or newly introduced table variants. This synchronization reduces the friction users encounter when searching for preferred content, thereby supporting longer sessions.
Privacy regulations in multiple jurisdictions require explicit consent for data collection, which influences how deeply analytics penetrate individual profiles. Operators in regions such as parts of Canada and Australia have adapted by offering granular opt-in choices, allowing users to control which behavioral signals feed into retention algorithms while still benefiting from broader platform improvements.
Measuring Long-Term Effectiveness
Key performance indicators include repeat deposit rates, average revenue per user, and lifetime value calculations. Platforms compare these metrics before and after implementing advanced analytics suites, often observing stabilization in user bases that previously showed seasonal declines. One operator group reported that its sports and virtual dealer divisions achieved a combined 12 percent lift in 90-day retention following the rollout of unified behavioral tracking in late 2025.
Conclusion
Data analytics continue to refine retention approaches by converting raw behavioral signals into actionable retention tactics across mobile sports wagering and virtual dealer platforms. As regulatory frameworks evolve and data sources expand, operators maintain focus on measurable outcomes that balance engagement goals with compliance requirements.